Prior to version 2.2, Lazarus IDE (only Lazarus from now on) used a GNU tool called GDB. As of version 2.2 Lazarus now has an internal debugger that according to many opinions is better and faster, it's called FpDebug.
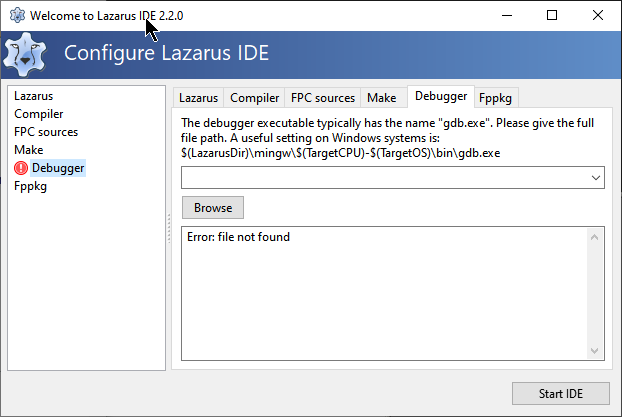
First of all, switching to FpDebug is not mandatory, GDB is still possible and on some occasions you will still see a warning message for the lack of GDB installed like this one:
After the IDE is installed, go to Tools|Options|Debugger|General and you will see this:
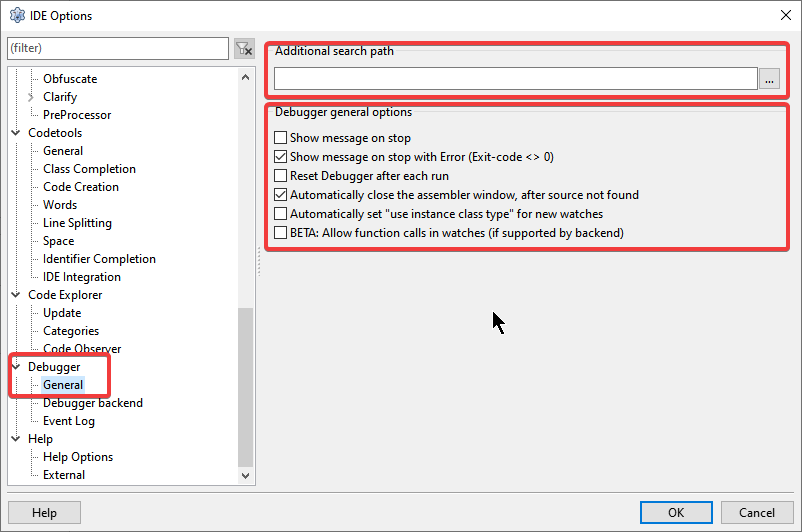
Traditionally the location now called 'Additional search path' should have the path to gdb.exe, but as I said, it's not gdb.exe anymore so for now we can leave it blank. Here are some options that I think are useful to have checked:
Show message on stop with Error(Exit-code<>0): The posix standard for any program whether it is windows or linux environment is to end with 'exit code' equal to zero to indicate to the operating system and/or subsequent programs that the program has finished without errors, any other code will indicate an alert(warning) or fatal error(fatal error). Windows usually returns values less than zero or greater than 255 to refer to alerts and greater than 1…254 to indicate errors, but in my experience as a programmer analyzing other programs I come to the conclusion that in this environment there is no standard except for commands (TUI) commands that usually repeat the MSDOS 'exit code', for example 'exit code' equals '2' to indicate 'file not found'. Pascaleiros, Javeiros, PHPeiros,… and a legion of programmers develop their own logging and debugging pattern, but it would be great if error messages went to stderr/stdout and that every program had an 'exit code' documented and following some pattern , so it would be much easier to program and debug program crashes using the operating system itself without needing assistance from other programs or 'inhouse' solutions made by the programmers themselves. That's why I keep this option turned on.
Automatically close the assembler windows, after source not found: When we are debugging line by line (step by step) the source code is triggered and even jumps to other codes that may not be available and in this case a window of debugger which shows the current code in assembly. Unfortunately my knowledge of assembler language has been lost over time so although useful, I have nothing to do when debugging it. That's why I keep this option turned on.
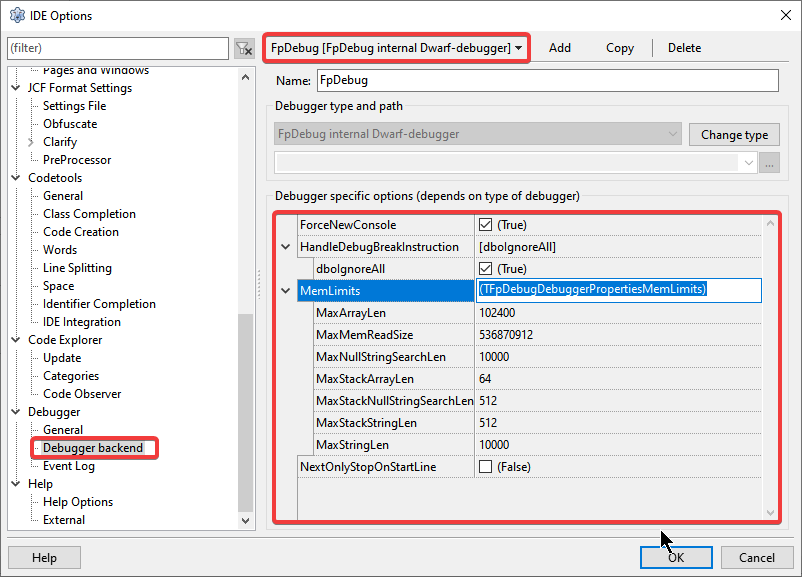
Now go to Tools|Options|Debugger|Debugger backend and you will see this:
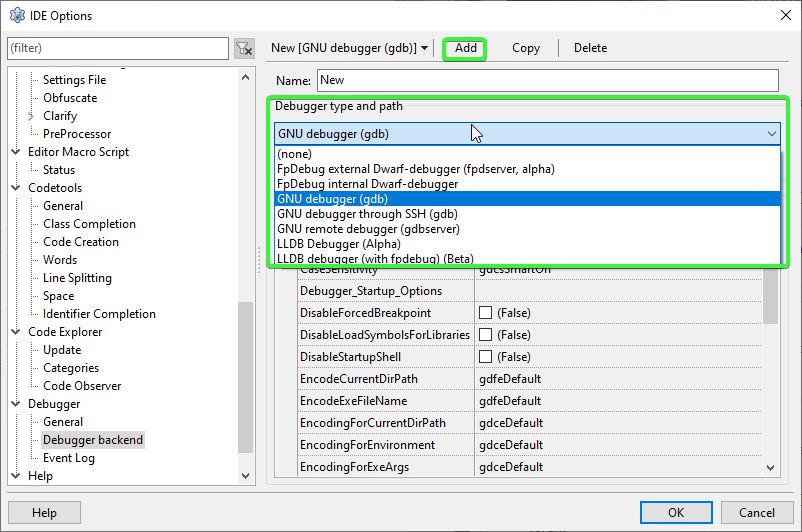
Se não estiver vendo o fpDebug, é provavel que o gdb ainda seja o padrão da sua IDE, se desejar trocar(e vai querer) siga as orientações:
- Ir em Tools|Options|Debugger|Debugger Backend e clicar em “Add”:
once indicated FPDebug Internal DWarf-debugger, there is not much more settings, the basic pre-configured is enough.
The breakpoints will still be the same as in the previous version:

The breakpoints you were used to in previous versions will still be the same, nothing has changed. Welcome to FpDebug!